I am looking for: Learn arrow down
I am looking for:
Categories
Categories
Graphing Systems

Answer the questions related to solving systems of equations by graphing. Use graph paper and your notes to help solve the questions and reach the honey pot!
Graphing By Standard Form And Solving Systems By Graphing

Line Graphs
Learners read an explanation of line graphs and demonstrate their knowledge of the parts of a graph in an interactive exercise.
Reading and Interpreting Bar Graphs

In this learning activity you'll identify the various parts of a bar graph, read and interpret its data, and calculate the data to solve various application problems.
Graphing Linear Equations

Answer the questions about graphing equations to win! Remember this is all about practice and learning, so try your best :)
By Abe Bonn
Data Table & Graph Review

Review Graphing Vocabulary. The last two questions use a graph found here: https://goo.gl/z3K9CA
Using Graphs to Explain Motion (Screencast)
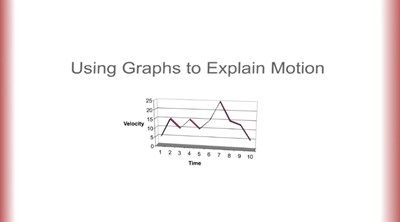
In this screencast, you'll observe two vehicles moving across the screen at different rates then describe the motion. Additionally, you'll select the corresponding graphs of distance vs. time, velocity vs. time, and acceleration vs. time for each vehicle.
Interpreting Line Graphs
In this learning activity you'll analyze line graphs and answer questions about the information shown.
Slope and Intercept on Graphing Calculators
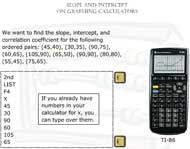
The learner reads directions for finding the slope, intercept, and correlation coefficient for a group of ordered pairs using one of eight different scientific calculators.
By Ron Keys
Graphic Design Basics: Typography

Graphical BJT/JFET Transistor Biasing
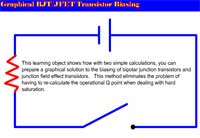
Learners use two calculations to prepare a graphical solution to the biasing of bipolar junction transistors and junction field effect transistors. This method eliminates the problem of having to re-calculate the operational Q point when dealing with hard saturation.
By Roger Brown
Graphing Vocabulary

Graphic Art Skills

Graphing Vocabulary

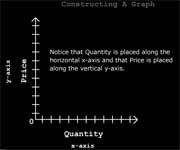
Constructing a Graph
y=mx+b Graphing Vocabulary

y=mx+b Graphing Review

Rapid fire for GRAPH THEORY

Transactional Communication Model (Graphic)
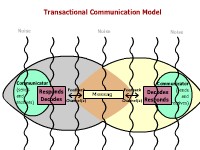
In this learning activity you'll view a graphical layout of the transactional communication model.