I am looking for: Learn arrow down
I am looking for:
Categories
Categories
Grouped Numerical Frequency Distributions Using Manual Means
In this learning activity you'll examine the terms associated with a grouped frequency distribution and follows the steps to construct a grouped frequency distribution using manual methods.
The Normal Distribution
In this learning activity you'll explore normal distribution and enter values for the mean and the standard deviation of normally distributed data and observe the resulting changes in the shape of the normal curve.
Ungrouped Numerical Frequency Distributions

Learners follow the steps required to construct an ungrouped frequency distribution using either manual methods or a spreadsheet.
The Standard Normal Distribution
In this learning activity you'll calculate the numeric value of an area when given the z scores.
The Area Under the Standard Normal Distribution
In this learning activity you'll identify and calculate the area under the normal curve specified by given z-scores.
The Normal Distribution and the Empirical Rule
In this learning activity you'll use the Empirical Rule to calculate the percentages of data between two data points.
Grouped Numerical Frequency Distributions: An Overview -- First in a Series
In this interactive object, students read about organizing data in a tabular form. A brief quiz completes the activity. This is the first in a series of six learning objects.
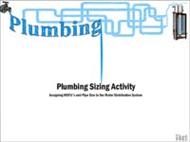
Plumbing Sizing Activity: Assigning WSFUs and Pipe Size to the Water Distribution System

The learner assigns water supply fixture units and pipe sizes to a water distribution system using the Wisconsin Plumbing Code and a uniform pressure loss worksheet.
By Randy Lorge
Grouped Numerical Frequency Distributions - Definitions: Second in a Series
In this interactive object, learners read the definitions of terms associated with the construction of a grouped frequency distribution. A brief quiz completes the activity.
Grouped Numerical Frequency Distributions - Determining the Range, Class, and Width: Fourth in a Series
Grouped Numerical Frequency Distributions - Establishing Class Boundaries: Sixth in a Series
Learners follow steps to establish class boundaries and tally the data using a spreadsheet.
Grouped Numerical Frequency Distributions -- Determining the Lower and Upper Limits: Fifth in a Series
Learners follow steps to establish the lower and upper limits in a spreadsheet.
Grouped Numerical Frequency Distributions - Identifying Low and High Values: Third in a Series
Students follow step-by-step directions for entering data into a spreadsheet and reporting the results.
Three Phase Wye Transformer Calculations
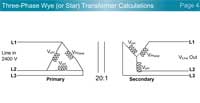
In this interactive object, learners follow steps to find phase voltages in a partial three-phase power distribution circuit.
Reactive Power
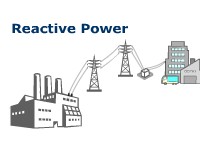
Students read an explanation of reactive power in a power distribution system involving motors, generators and transformers. A brief quiz completes the activity.
Residential Water Sizing Project -2
This object will allow the viewer to practice the necessary skills involved with sizing the water distribution system of a 1 family residence.
By Randy Lorge
The PDF File Format

In this animated object, learners examine the PDF (portable document format), which has become the standard file format in the printing industry for the distribution of printable documents.
By Dan Seanor
Supply Chain Management

This interactive activity represents the grid modeling technique, a heuristic model for choosing a centralized location for a manufacturing or distribution center within a supply chain network. The formula calculates a central point between the suppliers and the markets. This object requires the latest version of Flash Player.
Variation in Manufacturing: The Stable Process

Learners read a brief introduction to in-control and out-of-control conditions and view a series of distribution curves. This is a follow-up to the learning object titled "Quality Basics: Variation."
By John Stewart
Apparent Power
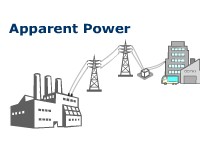
Learners read an explanation of the concept of apparent power in a power distribution system involving motors, generators, and transformers. A quiz completes this interactive lesson.