I am looking for: Learn arrow down
I am looking for:
Categories
Categories
Reading and Interpreting Bar Graphs

In this learning activity you'll identify the various parts of a bar graph, read and interpret its data, and calculate the data to solve various application problems.
Line Graphs
Learners read an explanation of line graphs and demonstrate their knowledge of the parts of a graph in an interactive exercise.
Using Graphs to Explain Motion (Screencast)
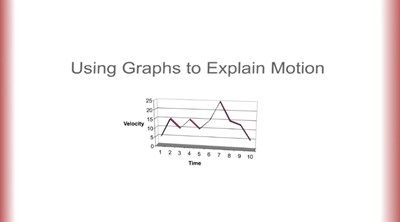
In this screencast, you'll observe two vehicles moving across the screen at different rates then describe the motion. Additionally, you'll select the corresponding graphs of distance vs. time, velocity vs. time, and acceleration vs. time for each vehicle.
Interpreting Line Graphs
In this learning activity you'll analyze line graphs and answer questions about the information shown.
Slope and Intercept on Graphing Calculators
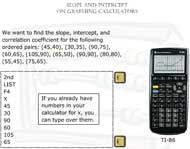
The learner reads directions for finding the slope, intercept, and correlation coefficient for a group of ordered pairs using one of eight different scientific calculators.
By Ron Keys
Heat of Fusion and Heat of Vaporization
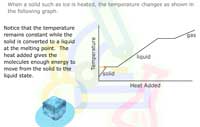
Learners examine graphs and read that the heat of fusion is the heat energy absorbed by one mole of solid as it is converted to liquid, while the heat of vaporization is the heat energy absorbed by one mole of liquid as it is converted to gas.
By Debbie McClinton Dr. Miriam Douglass Dr. Martin McClinton