I am looking for: Learn arrow down
I am looking for:
Categories
Categories
Evaluating the Six Trigonometric Functions
In this learning activity you'll evaluate the six trig functions using a scientific calculator.
By Roy Peterson
Formulas and Functions in Microsoft Excel

Formulas and Functions in Microsoft Excel
A learning object to illustrate the right way to enter formulas and functions in Excel.
The Timing Functions of Optical Sensors
In this animated object, learners examine the switch settings for the on-delay, off-delay, and one-shot timing functions of an optical sensor. A brief quiz completes the activity.
Hematologic Cells and their Functions: Blood Cell Identification (Screencast)
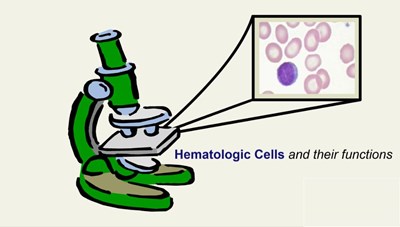
This screencast will help the student identify normal blood cells and their functions. This will include the identification of red blood cells, five types of white blood cells, and platelets.
By Carolyn Byom
Learn to Count by Common Radian Units
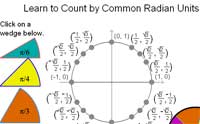
The target audience of this learning object is trigonometry students who have already learned what a radian is and have already derived the key values of the coordinates associated with common radian units, but now need to practice finding those values on the unit circle. The student does not need to know the definition of the six trig functions to do this activity.
By Laura Shears
Functions of Hydraulic Oil
Inverse Variation
Statics - Trig: Law of Cosines

Statics -- Trig: The Law of Sines
Statics - Trig: The Pythagorean Theorem
In this interactive object, learners use the Pythagorean Theorem to calculate forces.
Transfer Functions: The RL High Pass Filter (Screencast)
Learners read how the RL high pass filter is developed. The transfer function is used in Excel to graph the Vout. The circuit is also simulated in Electronic WorkBench and the resulting Bode plot is compared to the graph from Excel.
The TI-86 Scientific Calculator: The Editing Functions
Students read about the ENTRY, INS, and DEL keys and view a demonstration of how to edit and insert characters and recall previous entries.
Transfer Functions: The RC High Pass Filter
Learners read how the transfer function for a RC high pass filter is developed. The transfer function is used in Excel to graph the Vout. The circuit is also simulated in Electronic WorkBench and the resulting Bode plot is compared to the graph from Excel.
Statics - Trig: Pythagorean Theorem Calculations Using a Casio fx-260
In this animated and interactive object, the learner uses a Casio fx-260 calculator to solve for the magnitude of the resultant and of one of the component forces in a right triangle.
Transfer Functions: The RC High Pass Filter with Bode Plot
Students view the development of the transfer function for a RC high pass filter. They also read how a Bode plot is developed through simple approximation techniques for both the magnitude and phase.
Statics - Trig: Pythagorean Theorem Calculations Using a TI-86
In this animated and interactive object, the learner uses a TI-86 calculator to solve for the magnitude of the resultant and of one of the component forces in a right triangle.
Schmitt Trigger
In this animated object, learners examine the operation of a Schmitt Trigger IC and its hysteresis function. A brief quiz completes the activity.
Statics - Trig: The Law of Sines Using a TI-86 Calculator
In this interactive and animated object, learners apply the Law of Sines to determine forces using a TI-86 calculator.
Transfer Functions: The RL Low Pass Filter

Learners read how the transfer function for a RC low pass filter is developed. The transfer function is used in Excel to graph the Vout. The circuit is also simulated in Electronic WorkBench and the resulting Bode plot is compared to the graph from Excel.
Statics - Trig: Law of Cosines Using a TI-86 Calculator
In this interactive and animated object, learners apply the Law of Cosines to determine forces using a TI-86 calculator.