I am looking for: Learn arrow down
I am looking for:
Categories
Categories
Constructing a Graph
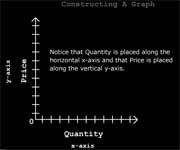
Line Graphs
Learners read an explanation of line graphs and demonstrate their knowledge of the parts of a graph in an interactive exercise.
How Metal Detectors Operate
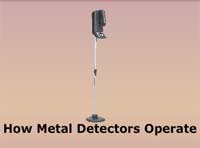
Learners examine how metal detectors function. This object includes animation and sound.
How to Really Be a Millionaire

In this learning activity you'll play "How to Really Be a Millionaire" to learn the basics of accumulating wealth.
How to Use the Fillet Gage
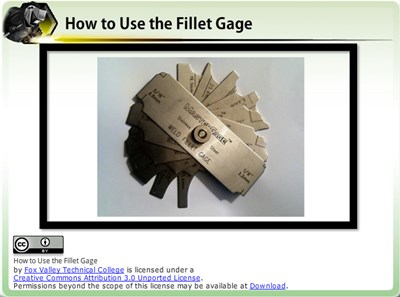
The learner will understand how to properly use a fillet gage to measure weld size.
Instantiation: Constructing an Object

In this learning activity you'll discover how constructors in the C# programming language are used to instantiate objects.
By Jay Stulo
Vine Nutrient Availability: How Cation Exchange Capacity, Base Saturation, and Soil pH affect vine nutrient availability
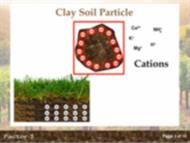
Learners examine how CEC, base saturation, and soil pH work with each other to define plant nutrient availability.
By Piero Spada
How the Ethernet Works

In this learning activity you'll explore how computers connected on a network use Ethernet technology.
The Anxiety Monster and How to Tame It
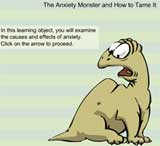
In this animated object, learners examine what anxiety is, how it affects people, and ways to manage it.
By Wendy Noble
Negative Roles: How They Affect Teamwork (Video)
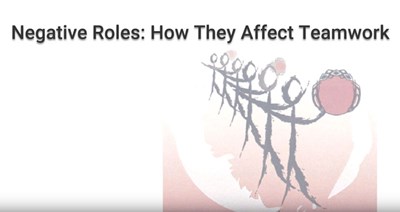
Learners identify negative roles, match statements characteristic of each role, and relate how they have handled negative teams.
By Rosie Bunnow
How to Evaluate a Problem Statement using MEA and IPO Techniques
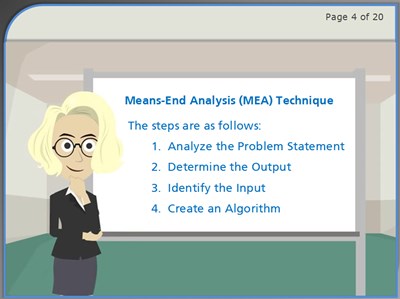
In this learning activity you'll discover how to evaluate a problem statement using both the MEA and the IP Techniques.
Request Response: How the Web Works

In this learning activity we’ll learn how the web works by using a Request and Response algorithm.
By carlfranklin
How Pressure Changes Boiling Temperature
Learners study the effect that pressure has on boiling temperatures. Once a liquid has reached a full boil, additional heat does not raise the liquid’s temperature; however, pressure can vary the boiling point of a liquid. A brief quiz completes the activity.
By Terry Bartelt Terry Fleischman
How Adding Parallel Branches Decreases Total Resistance
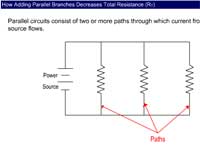
In this animated object, learners follow an analogy of water flowing through pipes and valves to see how resistance decreases in a parallel circuit as branches are added.
Transfer Functions: The RL High Pass Filter (Screencast)

Learners read how the RL high pass filter is developed. The transfer function is used in Excel to graph the Vout. The circuit is also simulated in Electronic WorkBench and the resulting Bode plot is compared to the graph from Excel.
Transfer Functions: The RC Low Pass Filter

Students read how the transfer function for a RC low pass filter is developed. The transfer function is used in Excel to graph the Vout. The circuit is also simulated in Electronic WorkBench and the resulting Bode plot is compared to the graph from Excel.
Transfer Functions: The RL High Pass Filter With Bode Plot

Learners read how the transfer function for a RL high pass filter is developed. The transfer function is used in Excel to graph the Vout. The circuit is also simulated in Electronic WorkBench, and the resulting Bode plot is compared to the graph from Excel.
How to Read a Caliper
In this interactive object, learners review how to read a caliper. They then test their skills with eight practice questions.
How to Use a Microscope

Learners examine the function of each part of a microscope and follow step-by-step instructions on how to focus on a specimen. They also review the proper use and care of a microscope and test their knowledge in two drag-and-drop exercises.
Reading and Interpreting Bar Graphs

In this learning activity you'll identify the various parts of a bar graph, read and interpret its data, and calculate the data to solve various application problems.