I am looking for: Learn arrow down
I am looking for:
Categories
Categories
Pie Charts/ Basic Social Studies (Video)
Students interpret pie chart information and identify the parts of a chart in an interactive exercise.
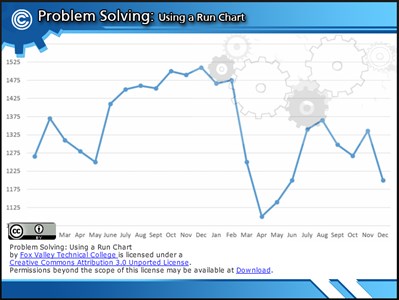
Problem Solving: Using a Run Chart
Problem Solving: Using a Flow Chart
You will learn how to us a flow chart to describe the process actions and decisions to find a solution.
By Mitch Vesaas
Identifying Non-Random Patterns on a Control Chart
In this learning activity you'll recognize several patterns on an Xbar and R control chart. These non-random patterns are indications that the process is not in a state of statistical control.
Quality Basics: The Pareto Chart
In this learning activity you'll calculate percentages, cumulative percentages, and answer questions related to sample Pareto charts.
Basic Types of Dimensioning Used in Engineering Drawings
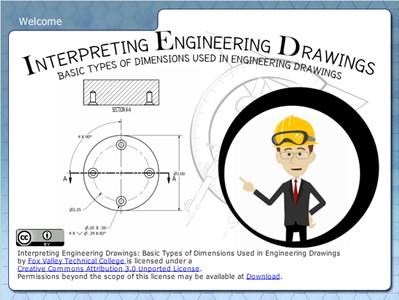
Learners examine the basic types of dimensioning including unidirectional and aligned systems, and linear, aligned, angled, arrowless, chain, datum, chart, tabular, radius, diameter, typical, and reference dimensions.
By Kelly Curran Glenn Sokolowski
Audience Characteristics Chart
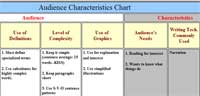
In this learning object you'll review information for layman, executive, expert, technician and operator audiences for writing technical publications.
By Terri Langan
Visual Logic Basic Programming: Using Flow Charts
In this learning activity you'll understand what flow charts are and how they're used to create computer programs.
Interpreting Line Graphs
In this learning activity you'll analyze line graphs and answer questions about the information shown.
Line Graphs
Learners read an explanation of line graphs and demonstrate their knowledge of the parts of a graph in an interactive exercise.
Dental Charting
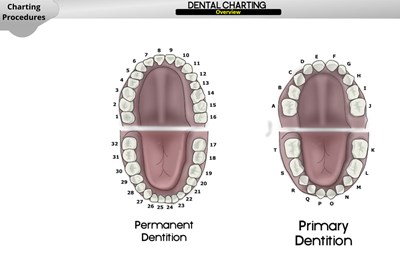
The purpose of this learning object is to introduce the dental hygienist to the process of documenting a patient's dentition.
Solving Percent Problems Using a Pyramid Grid (Screencast)
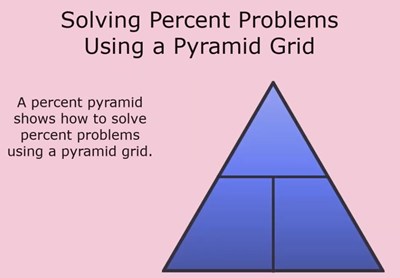
Students use the pyramid method to solve percent problems. The pyramid grid provides a visual way to set up the equation.
Personal Spending/Savings Plan for Teenagers
In this learning activity you'll review the basics of budgeting, income, and spending. Using an on-line form, you can create your own monthly budgets and a pie chart of your spending habits.
Circle of Familiars
In this learning activity you'll explain your placement of five people somewhere withing the circle of familiars chart.
Recreational Mathematics: Palindromes in Mathematics and the Search for Patterns
Users study a chart containing numbers 1 to 99 and look for trivial palindromes as well as double and triple iteration palindromes. The reverse and add technique is demonstrated.
Strength of Materials: Centroids of Composite Areas
In this interactive object, learners calculate a centroid of a composite area by first creating a chart. A short quiz completes the activity.
Welcome to the World of Prime Numbers
In this learning activity you'll use a chart and a calculator to find prime numbers 1 and 100.
The Process Flowchart - an Overview
Students view the steps, symbols, and benefits of creating a process flowchart. They then perform a self-assessment to determine their level of understanding.
By James Bork
Litigation Flowchart
In this interactive object, learners follow the litigation process from the filing of a court case through the filing of an appeal. Learners’ choices will move the case in different directions, based on the actions of the parties and the Court. A quiz completes the activity.
By Jody Cooper
Solubility of Ionic Compounds in Water

Learners view movie clips to determine the solubility of two ionic compounds. They also examine a solubility chart and predict the solubility of compounds.
By Dr. Miriam Douglass Dr. Martin McClinton