I am looking for: Learn arrow down
I am looking for:
Categories
Categories
Line Graphs

Learners read an explanation of line graphs and demonstrate their knowledge of the parts of a graph in an interactive exercise.
Reading and Interpreting Bar Graphs

In this learning activity you'll identify the various parts of a bar graph, read and interpret its data, and calculate the data to solve various application problems.
Using Graphs to Explain Motion (Screencast)
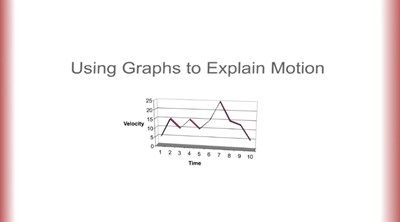
In this screencast, you'll observe two vehicles moving across the screen at different rates then describe the motion. Additionally, you'll select the corresponding graphs of distance vs. time, velocity vs. time, and acceleration vs. time for each vehicle.
Interpreting Line Graphs
In this learning activity you'll analyze line graphs and answer questions about the information shown.
Slope and Intercept on Graphing Calculators
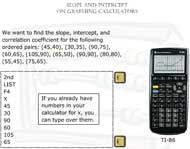
The learner reads directions for finding the slope, intercept, and correlation coefficient for a group of ordered pairs using one of eight different scientific calculators.
By Ron Keys
Graphical BJT/JFET Transistor Biasing
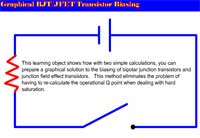
Learners use two calculations to prepare a graphical solution to the biasing of bipolar junction transistors and junction field effect transistors. This method eliminates the problem of having to re-calculate the operational Q point when dealing with hard saturation.
By Roger Brown
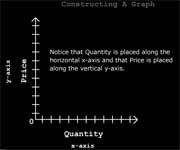
Constructing a Graph
Transactional Communication Model (Graphic)
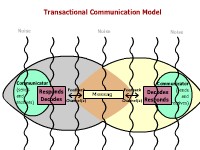
In this learning activity you'll view a graphical layout of the transactional communication model.
Statics: Resultant Calculations via Graphical Method
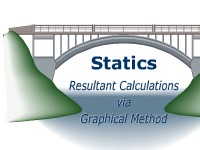
In this interactive learning object, students calculate a resultant of multiple forces acting in a concurrent, coplanar condition.
Creating Appropriate Graphics - Memo or Fax
In this learning activity you'll interpret phone messages to create a fax or a memo.
Transfer Functions: The RL High Pass Filter With Bode Plot

Learners read how the transfer function for a RL high pass filter is developed. The transfer function is used in Excel to graph the Vout. The circuit is also simulated in Electronic WorkBench, and the resulting Bode plot is compared to the graph from Excel.
Transfer Functions: The RL Low Pass Filter

Learners read how the transfer function for a RC low pass filter is developed. The transfer function is used in Excel to graph the Vout. The circuit is also simulated in Electronic WorkBench and the resulting Bode plot is compared to the graph from Excel.
Transfer Functions: The RL High Pass Filter (Screencast)

Learners read how the RL high pass filter is developed. The transfer function is used in Excel to graph the Vout. The circuit is also simulated in Electronic WorkBench and the resulting Bode plot is compared to the graph from Excel.
Transfer Functions: The RC Low Pass Filter

Students read how the transfer function for a RC low pass filter is developed. The transfer function is used in Excel to graph the Vout. The circuit is also simulated in Electronic WorkBench and the resulting Bode plot is compared to the graph from Excel.
Transfer Functions: The RC High Pass Filter

Learners read how the transfer function for a RC high pass filter is developed. The transfer function is used in Excel to graph the Vout. The circuit is also simulated in Electronic WorkBench and the resulting Bode plot is compared to the graph from Excel.
Orthographic Sketching
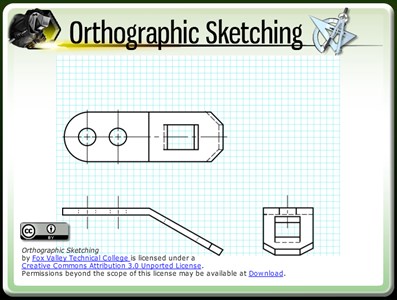
The learner will understand how to view an object for interpretation in the standard orthographic format and then accurately sketch three orthographic views using 3rd angle projection.
Orthographic Projection #1
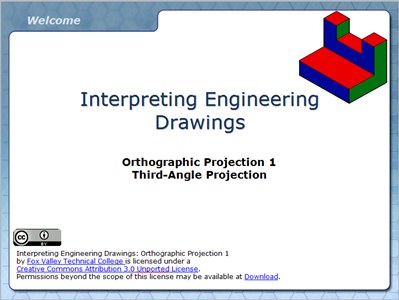
In this interactive and animated object, learners examine orthographic projection and the Glass Box Theory. Front, side, and top view development is demonstrated with pictorial views of each object to help develop 2D to 3D visualization skills.
The K-Shell Absorption Edge: A Close-Up Look at Radiography

In this lesson on atomic structure, learners examine how the binding energy of electrons affects light production in certain phosphors used in x-rays.
By Amber Schuck
Determining a Business Cycle Phase
In this learning activity you'll plot GDP data on a graph and determine a phase of the business cycle.
Mobile/Operative Radiography

Learners test their knowledge of mobile and operative radiography procedures while playing video soccer.
By Kay Parish