I am looking for: Learn arrow down
I am looking for:
Categories
Categories
Identifying Non-Random Patterns on a Control Chart
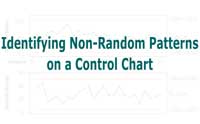
In this learning activity you'll recognize several patterns on an Xbar and R control chart. These non-random patterns are indications that the process is not in a state of statistical control.
Industrial Control Classifications

In this animated object, learners examine automated manufacturing systems classified as motion control, batch process control, and continuous process control.
Motor Control: Hands-on Testing and Troubleshooting Procedures for the Motor Control Lab
Learners follow a step-by-step explanation of how to test fuses and circuit interrupting devices.
By Dick Dierks
Pie Charts/ Basic Social Studies (Video)
Students interpret pie chart information and identify the parts of a chart in an interactive exercise.
Negative Roles: How They Affect Teamwork (Video)
Learners identify negative roles, match statements characteristic of each role, and relate how they have handled negative teams.
By Rosie Bunnow
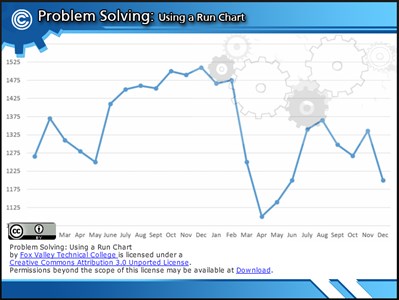
Problem Solving: Using a Run Chart
Derivative Control Mode Analogy (Screencast)
In this animated object, learners view a race of two boats as an example of how the derivative function of a PID controller shortens the time duration of an operation.
Eagle Power Roller - Operator's Control Panel
In this learning activity you'll discover how the Eagle Power Roller control panel operates.
By Dave Hoffman
Problem Solving: Using a Flow Chart
You will learn how to us a flow chart to describe the process actions and decisions to find a solution.
By Mitch Vesaas
GD&T - The Feature Control Frame (Screencast)
In this screencast, Geometric Dimensioning & Tolerancing: The Feature Control Frame, learners examine geometric characteristic symbols, tolerances, datum feature symbols, and other control frame information.
Controlling pH

Learners view an animated presentation showing how the pH level of a cleaning solution is controlled in a closed-loop system in a manufacturing setting. A quiz completes the activity.
The Feed-Forward Control System
In this animated object, learners examine the operation of a feed-forward control system and its advantages over a closed-loop system. A brief quiz completes the activity.
CNC Control Features
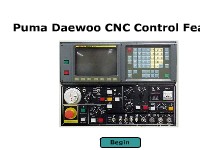
In this learning activity you'll discover the features of a Puma Daewoo O-T CNC Lathe Control panel.
By Terry Tower
Hydraulic Directional Control Valves
In this animated activity, learners examine the operation of hydraulic directional control valves and the internal components that divert the fluid.
Multi-Rung Control in a Ladder Circuit
Learners study the operation of a ladder circuit in which coils on one rung control contacts in other rungs.
Analog Position Control (Screencast)
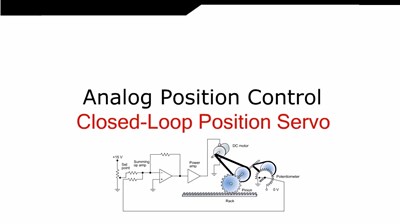
In this animated object, learners examine an analog closed-loop feedback system that uses potentiometers to control the position of a gear rack.
Making the Workplace Talk to You: Using Visual Controls
Learners examine how visual controls help to manage the workplace. Photos of visual controls are provided.
By Kaye Krueger
Digital Position Control
In this animated object, learners examine a closed-loop feedback system that uses digital circuits to control the position of a gear rack.
How Metal Detectors Operate
Learners examine how metal detectors function. This object includes animation and sound.
Bloodborne Pathogens: Exposure Control Plan
Learners examine OSHA's guidelines of what to include in a bloodborne pathogen exposure control plan for persons who work in general industry, health care, emergency medical services, law enforcement, education, recreation industries, or other occupations in which there is a potential for exposure to blood, blood products, bodily fluids, or human tissues.