I am looking for: Learn arrow down
I am looking for:
Categories
Categories
Interpreting Line Graphs
In this learning activity you'll analyze line graphs and answer questions about the information shown.
Line Graphs

Learners read an explanation of line graphs and demonstrate their knowledge of the parts of a graph in an interactive exercise.
Print Reading: An Alphabet of Lines in Print Reading
In this animated activity, learners read about the types of lines found on blueprints. A quiz completes the activity.
By Kelly Curran
How to Read a Caliper
In this interactive object, learners review how to read a caliper. They then test their skills with eight practice questions.
Reading and Interpreting Bar Graphs

In this learning activity you'll identify the various parts of a bar graph, read and interpret its data, and calculate the data to solve various application problems.
Phase Relationships Between Line-Neutral and Line-Line Voltages

Learners view a demonstration showing that line-neutral voltages and line-line voltages are not in-phase with each other, but have a definite 30-degree relationship.
By Michael Gradinjan Terry Fleischman
Transfer Functions: The RL High Pass Filter With Bode Plot
Learners read how the transfer function for a RL high pass filter is developed. The transfer function is used in Excel to graph the Vout. The circuit is also simulated in Electronic WorkBench, and the resulting Bode plot is compared to the graph from Excel.
Transfer Functions: The RL High Pass Filter (Screencast)

Learners read how the RL high pass filter is developed. The transfer function is used in Excel to graph the Vout. The circuit is also simulated in Electronic WorkBench and the resulting Bode plot is compared to the graph from Excel.
Process Variation

In manufacturing, controlling the production process is critical. Part of this control is knowing when to make adjustments and when to let the line run. Step onto the production line in our manufacturing plant and learn what process variation is and how it impacts your bottom line.
Transfer Functions: The RL Low Pass Filter

Learners read how the transfer function for a RC low pass filter is developed. The transfer function is used in Excel to graph the Vout. The circuit is also simulated in Electronic WorkBench and the resulting Bode plot is compared to the graph from Excel.
Finding the Coordinates of the Point Where an Arc Blends Into a Line

Students use trigonometry to find the coordinates of the blending point where a line and an arc meet. Learners are given the coordinates of the center of the arc, the radius of the arc, and the direction of the line.
By Alan Dohm
Transfer Functions: The RC Low Pass Filter

Students read how the transfer function for a RC low pass filter is developed. The transfer function is used in Excel to graph the Vout. The circuit is also simulated in Electronic WorkBench and the resulting Bode plot is compared to the graph from Excel.
Transfer Functions: The RC High Pass Filter

Learners read how the transfer function for a RC high pass filter is developed. The transfer function is used in Excel to graph the Vout. The circuit is also simulated in Electronic WorkBench and the resulting Bode plot is compared to the graph from Excel.
Linear Displacement Transducer
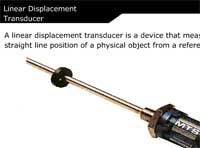
Learners examine how a linear displacement transducer is used to measure the linear position of a physical object. Animations show the sequential steps of the entire operation.
How Metal Detectors Operate
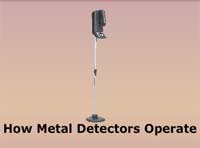
Learners examine how metal detectors function. This object includes animation and sound.
Reading the Title Block

In this activity we’ll explain what a title block is and how to read the information it holds.
Lathe Project: Turning Using a Digital Readout
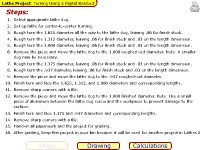
Users read work instructions and view a drawing and calculations for turning on a lathe using a digital readout.
The Transfer Functions: RC Low-Pass Filter with a Bode Plot

Students read how the transfer function is developed for an RC low-pass filter. A straight line Bode plot is drawn through close approximations.
Vine Nutrient Availability: How Cation Exchange Capacity, Base Saturation, and Soil pH affect vine nutrient availability
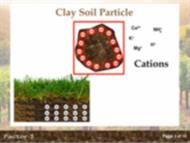
Learners examine how CEC, base saturation, and soil pH work with each other to define plant nutrient availability.
By Piero Spada
Why Nano?
Learners read how nanotechnology is creating new jobs in emerging industries while making others obsolete. This colorful and animated activity also looks at the types of products being created through the use of technology and how educational institutions have responded.