I am looking for: Learn arrow down
I am looking for:
Categories
Categories
Reading and Interpreting Bar Graphs

In this learning activity you'll identify the various parts of a bar graph, read and interpret its data, and calculate the data to solve various application problems.
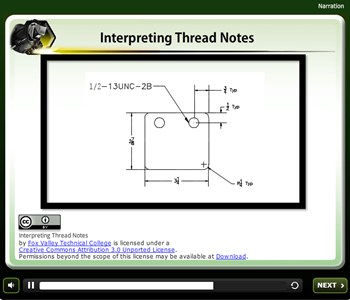
Interpreting Thread Notes
Interpreting Line Graphs
In this learning activity you'll analyze line graphs and answer questions about the information shown.
Interpreting Engineering Drawings: Sheet Sizes

In this animated and interactive object, learners view American National Standard and International Standard sheet sizes. A quiz completes the activity.
Interpreting Engineering Drawings: Title and Revision Blocks (Screencast)
Learners examine the information on a title block and answer questions about that information in an interactive quiz.
Interpreting Engineering Drawings: Common Abbreviations
In this interactive object, learners read the common abbreviations used in engineering drawings and then test their knowledge in three short exercises.
Interpreting the Resistor Color Code
Students examine how to interpret resistor color code bands to determine resistance values and tolerance ranges. This interactive learning object has audio content and includes exercises.
Interpreting Hematology Lab Results

Learners examine a CBC and study the functions of blood cells, the normal range for each item on the CBC, and possible reasons for increases or decreases from the normal range.
By Kathleen Lee
Cardiac Marker Case Studies

The learner will learn how to understand, interpret, and correlate cardiac marker test results.
The Accounting Cycle
Learners examine the 10 steps of the accounting cycle. The cycle begins with the analysis of source documents and ends with the post-closing trial balance and interpreting the financial information.
By Lynette Teal
Selector Switch Labeling
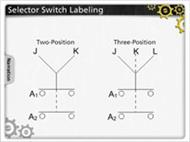
In this animated object, learners examine the method of interpreting the truth tables for two-position and three-position selector switches on ladder logic circuit diagrams.
Learning About Your Earnings (Screencast)
In this learning activity you'll practice reading and interpreting a paychecks and paycheck stub.
Forensic Lamp Examination (Screencast)
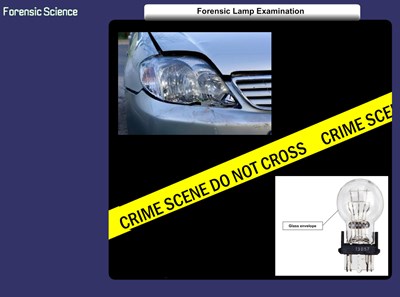
This learning object is designed to assist students in understanding and interpreting collision evidence found in automotive lamps. In particular, the concepts of Hot Shock, Cold Shock, Hot Break, and Cold Break will be visually addressed.
The Accounting Definition
Learners examine the accounting process of recording, classifying, summarizing, interpreting, and communicating.
By Lynette Teal