I am looking for: Learn arrow down
I am looking for:
Categories
Categories
The Fungi Kingdom: Common Characteristics of Fungi

Learners examine what defines a fungus and read how fungi differ from animals and plants.
Transfer Functions: The RL Low Pass Filter

Learners read how the transfer function for a RC low pass filter is developed. The transfer function is used in Excel to graph the Vout. The circuit is also simulated in Electronic WorkBench and the resulting Bode plot is compared to the graph from Excel.
Formulas and Functions in Microsoft Excel

Formulas and Functions in Microsoft Excel
A learning object to illustrate the right way to enter formulas and functions in Excel.
Transfer Functions: The RC Low Pass Filter

Students read how the transfer function for a RC low pass filter is developed. The transfer function is used in Excel to graph the Vout. The circuit is also simulated in Electronic WorkBench and the resulting Bode plot is compared to the graph from Excel.
Transfer Functions: The RC High Pass Filter

Learners read how the transfer function for a RC high pass filter is developed. The transfer function is used in Excel to graph the Vout. The circuit is also simulated in Electronic WorkBench and the resulting Bode plot is compared to the graph from Excel.
Transfer Functions: The RL High Pass Filter With Bode Plot
Learners read how the transfer function for a RL high pass filter is developed. The transfer function is used in Excel to graph the Vout. The circuit is also simulated in Electronic WorkBench, and the resulting Bode plot is compared to the graph from Excel.
Evaluating the Six Trigonometric Functions
In this learning activity you'll evaluate the six trig functions using a scientific calculator.
By Roy Peterson
The TI-86 Scientific Calculator: Using the Log Function
This primer introduces the student to the correct method of using the log function on a TI-86 calculator.
The TI-83 Plus Calculator: Using the Exponent Function
This primer introduces the student to the proper use of the "EE" function to perform calculations on very large or very small numbers.
The Timing Functions of Optical Sensors
In this animated object, learners examine the switch settings for the on-delay, off-delay, and one-shot timing functions of an optical sensor. A brief quiz completes the activity.
Identifying Hand Tools by Function

Transfer Functions: The RC High Pass Filter with Bode Plot

Students view the development of the transfer function for a RC high pass filter. They also read how a Bode plot is developed through simple approximation techniques for both the magnitude and phase.
Hematologic Cells and their Functions: Blood Cell Identification (Screencast)
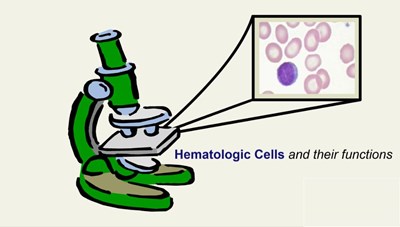
This screencast will help the student identify normal blood cells and their functions. This will include the identification of red blood cells, five types of white blood cells, and platelets.
By Carolyn Byom
The TI-83 Plus Calculator: Using the Arctangent Function
Learners read how to use the arctangent function to calculate the theta of an angle. The proper keystrokes are displayed.
Functions of Hydraulic Oil
Fundamental Laws of Algebra
Learners review the fundamental laws of algebra including the commutative law of addition, the commutative law of multiplication, the associative law of addition, the associative law of multiplication, and the distributive law. Examples are given.
Transfer Functions: The RL High Pass Filter (Screencast)
Learners read how the RL high pass filter is developed. The transfer function is used in Excel to graph the Vout. The circuit is also simulated in Electronic WorkBench and the resulting Bode plot is compared to the graph from Excel.
Pulse Train Fundamentals
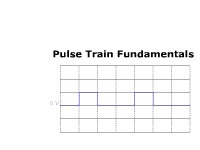
Learners examine the fundamentals of a pulse train. Concepts such as time on, time off, duty cycle, period, and frequency are covered.
The Counter-Reset Function
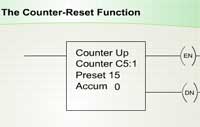
Learners examine the counter-reset function of a programmable controller and how it is used.
The TI-86 Scientific Calculator: Using the Exponent Function
This primer introduces the student to the proper use of the exponent (EE) function on a TI-86 calculator.