I am looking for: Learn arrow down
I am looking for:
Categories
Categories
Problem Solving - Describing the Problem
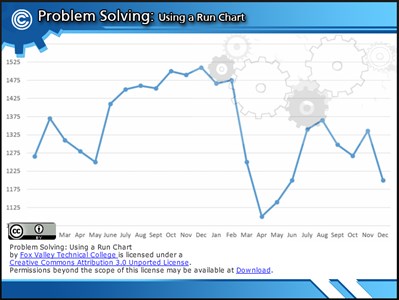
The learner will understand how to measure a problem over time by using a common run chart to visualize the gap between past performance and future goals.
By Mitch Vesaas
Problem Solving: Using a Run Chart
Visual Logic Basic Programming: Using Flow Charts
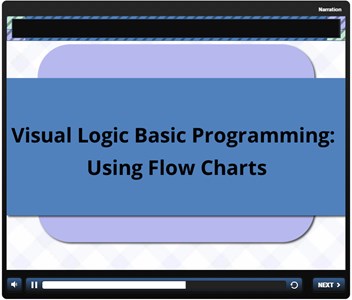
In this learning activity you'll understand what flow charts are and how they're used to create computer programs.
The CLR: Overview of the Common Language Runtime

Pie Charts/ Basic Social Studies (Video)
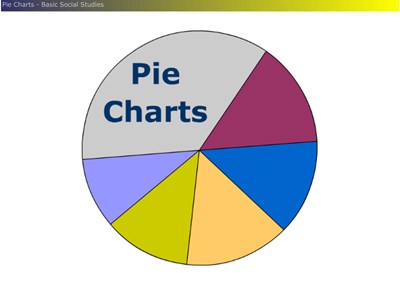
Students interpret pie chart information and identify the parts of a chart in an interactive exercise.
Series Motor Runaway (Screencast)
Learners consider the changes inside a series motor that could cause it to break apart if the load was disconnected. A quiz completes the activity.
Process Variation

In manufacturing, controlling the production process is critical. Part of this control is knowing when to make adjustments and when to let the line run. Step onto the production line in our manufacturing plant and learn what process variation is and how it impacts your bottom line.
Cascading Magnitude Comparators
Learners read an explanation of how to connect two 7485 ICs to compare binary numbers by creating an 8-bit comparator. Diagrams and charts are presented.
Determining Punch & Dies for Press Brake Forming
Introduction to selecting the proper punch and die for air bending or bottoming when forming on a press brake. Includes charts and methods for selection.
By Dave Hoffman
Quality Basics: The Pareto Chart
In this learning activity you'll calculate percentages, cumulative percentages, and answer questions related to sample Pareto charts.
What's for Supper?
The learner sorts a variety of foods based on personal preferences. Those personal choices are then classified by food group. The learner views the charts and reads information about the major food groups.
By Tracy Craker
Multi-Rung Control in a Ladder Circuit
Learners study the operation of a ladder circuit in which coils on one rung control contacts in other rungs.
Atomic Weight
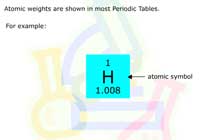
Learners read the definition of atomic weight and obtain the weights of elements by viewing the Periodic Table and charts that list atomic weights by name or symbol.
By Debbie McClinton Dr. Miriam Douglass Dr. Martin McClinton
Budgeting Monthly Expenses
In this learning activity you'll establish your budget by determining your earnings, expenses, and goals.
Identifying Non-Random Patterns on a Control Chart
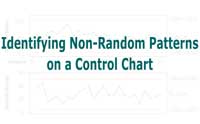
In this learning activity you'll recognize several patterns on an Xbar and R control chart. These non-random patterns are indications that the process is not in a state of statistical control.
Ladder Circuit Labeling
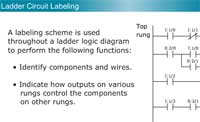
Learners examine the labeling scheme used in ladder logic diagrams to identify components, wires, rungs, and rails. This activity includes self-check questions.
Electromagnets

Learners examine how an electromagnet is formed. Animated illustrations show current running through a coil wrapped around an iron core.
Troubleshooting an Unstable Press Motor

In this simulation activity, an electrician will troubleshoot an AC motor that quit running and cannot be restarted. Before accessing blueprints and then using a multimeter to find the fault, the learner will follow safety protocols by following lock-out tag-out procedures and then suit up with appropriate (PPE) personal protection equipment.
The IR Comp Network
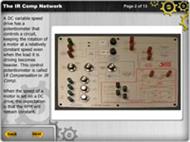
In this animated activity, learners examine the circuitry in a DC variable speed drive that keeps the motor running at a constant speed as the load varies.
Identifying Incorrect Sentences
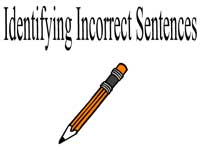
In this interactive object, learners identify run-on sentences, comma splices, and sentence fragments.