I am looking for: Learn arrow down
I am looking for:
Categories
Categories
Evaluating the Six Trigonometric Functions
In this learning activity you'll evaluate the six trig functions using a scientific calculator.
By Roy Peterson
Stain Measurement & Calculating Angles of Impact (Screencast)
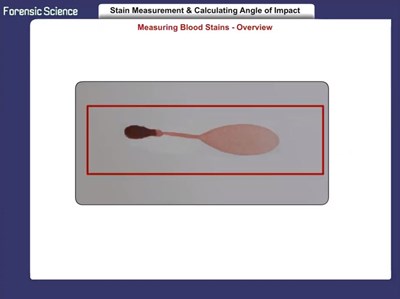
In this learning object the student will learn how to measure a stain and calculate angles of impact. Determining the angle of impact for bloodstains takes advantage of the trigonometric functions (Sine function).
A mathematical relationship exists between the width and length of an elliptical bloodstain which allows for the calculation of the angle of the impact for the original spherical drop of blood.
Given well formed stains we can accurately measure the width and length by simply dividing the stain along it’s major and minor axis. The opposite halves would be generally equal to each other which aids in establishing the impact angle.
Formulas and Functions in Microsoft Excel

Formulas and Functions in Microsoft Excel
A learning object to illustrate the right way to enter formulas and functions in Excel.
Statics - Trig: The Pythagorean Theorem
In this interactive object, learners use the Pythagorean Theorem to calculate forces.
Statics -- Trig: The Law of Sines
The Timing Functions of Optical Sensors
In this animated object, learners examine the switch settings for the on-delay, off-delay, and one-shot timing functions of an optical sensor. A brief quiz completes the activity.
Statics - Trig: Law of Cosines

How Metal Detectors Operate
Learners examine how metal detectors function. This object includes animation and sound.
How to Evaluate a Problem Statement using MEA and IPO Techniques
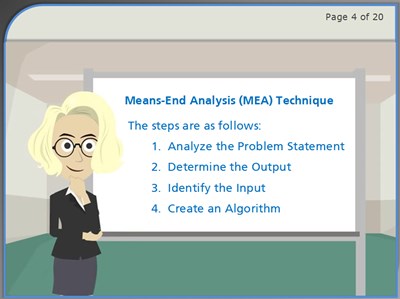
In this learning activity you'll discover how to evaluate a problem statement using both the MEA and the IP Techniques.
Hematologic Cells and their Functions: Blood Cell Identification (Screencast)
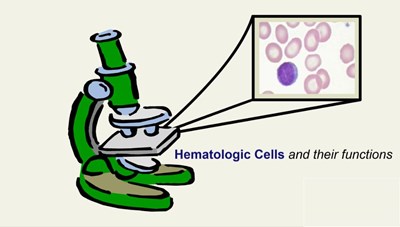
This screencast will help the student identify normal blood cells and their functions. This will include the identification of red blood cells, five types of white blood cells, and platelets.
By Carolyn Byom
The Transfer Functions: RC Low-Pass Filter with a Bode Plot

Students read how the transfer function is developed for an RC low-pass filter. A straight line Bode plot is drawn through close approximations.
How to Use a Microscope

Learners examine the function of each part of a microscope and follow step-by-step instructions on how to focus on a specimen. They also review the proper use and care of a microscope and test their knowledge in two drag-and-drop exercises.
The TI-83 Plus Calculator: The Editing Functions
Students read about the ENTRY, INS, and DEL keys and view a demonstration of how to edit and insert characters and recall previous entries.
Transfer Functions: The RL Low Pass Filter

Learners read how the transfer function for a RC low pass filter is developed. The transfer function is used in Excel to graph the Vout. The circuit is also simulated in Electronic WorkBench and the resulting Bode plot is compared to the graph from Excel.
How to Listen Better (Screencast)

The learner examines what it means to listen respectively and how to become a better listener.
Transfer Functions: The RL High Pass Filter (Screencast)

Learners read how the RL high pass filter is developed. The transfer function is used in Excel to graph the Vout. The circuit is also simulated in Electronic WorkBench and the resulting Bode plot is compared to the graph from Excel.
How Old Are You?
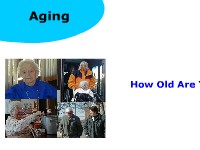
In this interactive learning activity, learners explore factors that contribute to the aging process. Learners calculate their age based on biological, psychological, and social experiences. Further reflection allows the learner to consider options and assess issues that impact the aging process.
By Ann Jadin
How Pressure Changes Boiling Temperature
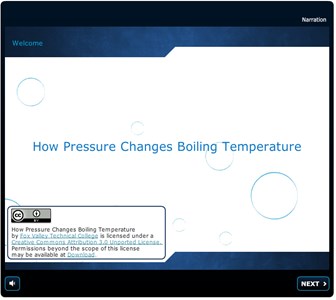
Learners study the effect that pressure has on boiling temperatures. Once a liquid has reached a full boil, additional heat does not raise the liquid’s temperature; however, pressure can vary the boiling point of a liquid. A brief quiz completes the activity.
By Terry Bartelt Terry Fleischman
How to Really Be a Millionaire

In this learning activity you'll play "How to Really Be a Millionaire" to learn the basics of accumulating wealth.
How the Ethernet Works
In this learning activity you'll explore how computers connected on a network use Ethernet technology.