I am looking for: Learn arrow down
I am looking for:
Categories
Categories
Reading a Triple Beam Balance
Students identify the parts of a triple beam balance and practice measuring the mass of objects.
By Jill Crowder
Database Naming Conventions
In this learning activity, you'll discover and then follow established rules when naming database objects.
By jamiecchavez
Instantiation: Constructing an Object
In this learning activity you'll discover how constructors in the C# programming language are used to instantiate objects.
By Jay Stulo
Personal Pronouns - Exercise 1

In this learning activity you'll complete exercises using personal pronouns as subjects or objects.
By Rosie Bunnow
Personal Pronouns - Exercise 2
In this learning activity you'll complete exercises using personal pronouns as subjects or objects.
By Rosie Bunnow
Brain Exercise: Visualization #3
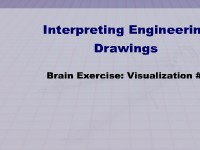
Learners develop 3D visualization skills by examining front, side, and top orthographic views of objects. Using this information, students select the corresponding isometric view of each object.
Five "S" System in Manufacturing
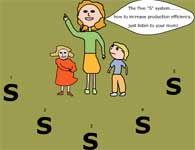
This objects reviews the Five "S" manufacturing system and helps learners to remember the process.
By Weldon Faull
Excel: Spreadsheet Hints
Learners read how to create a spreadsheet to determine the voltage drop across a resistor in an AC circuit. The complex functions explained in other learning objects are used in this example.
Space Relations Assessment Examples
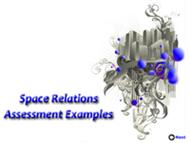
Learners mentally manipulate two-dimensional diagrams to visualize the objects in their three-dimensional forms.
Grouped Numerical Frequency Distributions: An Overview -- First in a Series
In this interactive object, students read about organizing data in a tabular form. A brief quiz completes the activity. This is the first in a series of six learning objects.
Object or Class?
In this learning activity, you'll watch an animated explanation of the terms class and object as used by computer programmers, and then contrast the differences.
By Jay Stulo