I am looking for: Learn arrow down
I am looking for:
Categories
Categories
Statics: Resultant Calculations via Tabular Method
The learner calculates the resultant of multiple forces acting in a concurrent, coplanar load condition.
Statics: Resultant Calculations via Graphical Method
In this interactive learning object, students calculate a resultant of multiple forces acting in a concurrent, coplanar condition.
Correlation of Colony Morphology with Gram Stain Results
Students choose the hypothesis and practice describing bacterial colonies using the steps of the scientific method.
By Pat Griffin Mary Beth Boettcher Marise Hussey
Interpreting Hematology Lab Results
Learners examine a CBC and study the functions of blood cells, the normal range for each item on the CBC, and possible reasons for increases or decreases from the normal range.
By Kathleen Lee
Attitudes Matter

In this interactive object, learners consider the importance of demonstrating a positive attitude. They reflect on their own experiences and challenge themselves to let go of preconceived notions.
What is Biosecurity?

At the end of this lesson you will be able to
- Explain what biosecurity means.
- Describe why biosecurity is important.
- Identify what kinds of disease agents we try to prevent or control with biosecurity.
- Demonstrate disease agent-host-environmental interactions that result in disease.
Conditional Sentences
In this learning activity you'll review conditional sentences and match the "if clause" with the correct "result clause."
By Debra Shover
The Law of Color

In this animated object, students examine the shades that result from mixing primary and secondary colors. Color tone and level are also defined.
By Joan Kornitz
MIC Susceptibility Test
The student will read MIC susceptibility results from a microtiter panel for various common pathogens. Results can then be interpreted as susceptible, moderately susceptible, or resistant by referring to interpretation chart.
Careers in Criminal Justice

Learners view videos of law enforcement and corrections officers describing their jobs and the opportunities in their fields. Because this object contains large video files, it is best viewed using a high band width connection. Low band widths will result in longer download time and video delays.
Pilot-Operated, Pressure-Reducing Valve Malfunctions

In this animated activity, users examine the causes of malfunctions in a hydraulic pressure-reducing valve and the problems that result. A short quiz completes the learning object.
By Terry Bartelt Stephen Schneider
The Upper and Lower Motor Neurons (Screencast)
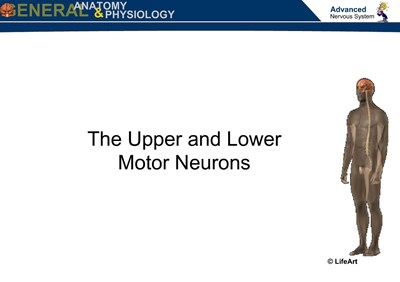
In this screencast, learners examine the function and location of the motor neurons and the damage that can result when they are injured.
Hydraulic Filters
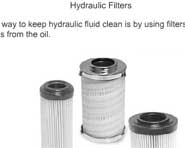
Studies show that more than 75 percent of all hydraulic system failures are a direct result of unclean oil. In this interactive object, learners examine the three primary types of hydraulic system filters. A brief quiz completes the activity.
Cardiac Marker Case Studies

The learner will learn how to understand, interpret, and correlate cardiac marker test results.
Maximum Power Transfer

Learners are introduced to the maximum power transfer theorem. Examples show the load as it varies and the results are graphed.
Transfer Functions: The RC Low Pass Filter

Students read how the transfer function for a RC low pass filter is developed. The transfer function is used in Excel to graph the Vout. The circuit is also simulated in Electronic WorkBench and the resulting Bode plot is compared to the graph from Excel.
Regulators of Blood Osmolality and Blood Volume

In this learning object, you will learn about four blood osmolality and volume regulators, their sites of production, their sites of action, and the results of those actions.
Sample Size & Reduction

Discover the fascinating intersection of veterinary science and human medicine in this module. "Can Animal Studies Predict Human Results?" Dive into groundbreaking research and ethical debates as we explore how animal testing influences the future of medical breakthroughs by unraveling the complexities of animal and human testing.
By BioLEAP
Transfer Functions: The RC High Pass Filter

Learners read how the transfer function for a RC high pass filter is developed. The transfer function is used in Excel to graph the Vout. The circuit is also simulated in Electronic WorkBench and the resulting Bode plot is compared to the graph from Excel.
The Normal Distribution

In this learning activity you'll explore normal distribution and enter values for the mean and the standard deviation of normally distributed data and observe the resulting changes in the shape of the normal curve.